
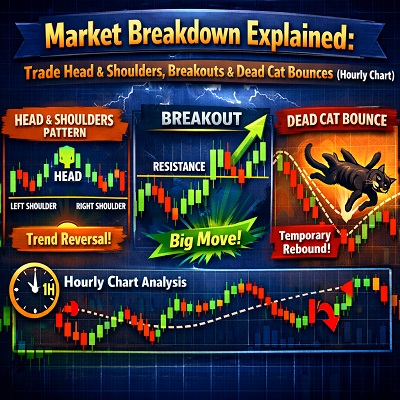
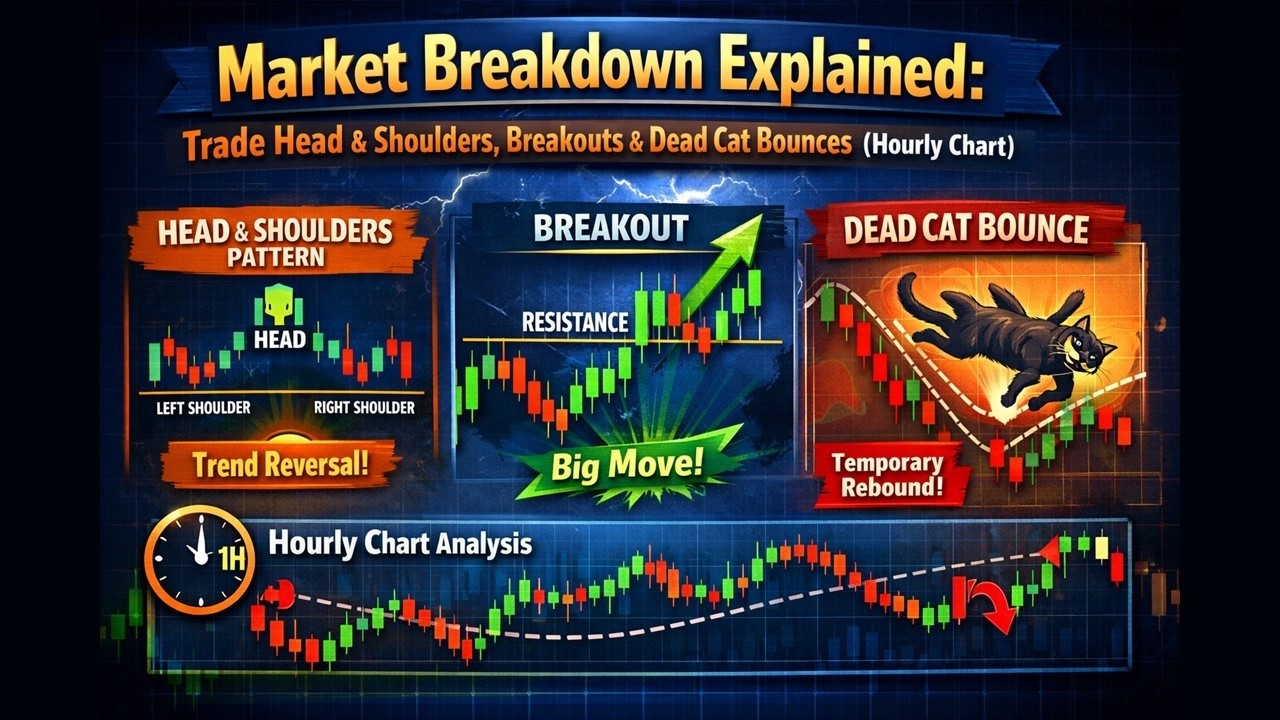
This hourly-chart breakdown shows how to identify support failures, head & shoulders patterns, and repeated dead cat bounces. If you trade breakouts, reversals, or short-term options, this step-by-step guide explains where to enter, where to protect, and how to manage risk for high-probability moves.
Click here or on the video below to learn more!
Subscribe: YouTube
Subscribe: Soundcloud
What happened on the chart?
- Price broke out to a new high, then retested the breakout zone multiple times.
- The market repeatedly rejected new highs and failed to hold horizontal support.
- The pattern formed a classic head & shoulders structure, confirming a likely drop.
- Larger-than-normal bearish candles and a gap down increased the odds of a deeper decline.
How to spot a support failure and rejection zone
- Look for a breakout followed by retests of the same level. Multiple retests bounces that fail indicate weakening demand.
- Watch for repeated small bounces that fail to sustain.
- Confirm with larger-than-normal bearish candles and strong follow-through selling.
- Mark horizontal levels where price previously stalled or reversed — these become key zones.
Trading plan — entries, stops, targets
- Short bias after confirmed support failure and head & shoulders breakdown. Enter on break or on a failed bounce into the former support zone.
- For long attempts, play small size: risk should be limited with tight stops beneath the recent low or below the rejection zone.
- Targets: first logical target for down move is the next significant horizontal support; a full move can often reach the measured move from the head & shoulders pattern.
- Scale and size: use partial sizing on initial entries and add only if price confirms direction. Protect remaining position with trailing stops.
Options ideas — 0 DTE vs longer-dated
- 0 DTE (same-day) options can amplify short-term directional moves with small capital but require precise timing and quick exits.
- Longer-dated options reduce time decay risk but require more risk and larger moves for the same % return on risk.
- Choose strike and expiration based on expected point move, timing, and your risk tolerance. Use small position sizes for high-volatility setups.
Risk management and trade psychology
- Define maximum loss per trade and stick to it. Small loss attempts on long shots are acceptable if they fit your plan.
- Avoid revenge trading after a failed bounce — wait for clear opportunity.
- Use position sizing to protect capital and preserve the ability to trade future opportunities.
Example step-by-step trade (from the video)
- Identify breakdown and mark support zone.
- Observe multiple retests and failed bounces.
- Watch for a clear break below the support with larger bearish candles.
- Enter short on break or on a retest into the broken zone with a tight stop.
- Set target at the next horizontal support; scale out partial size on first target.
- Option traders: buy short-term contracts for quick moves or longer-dated for longer term larger targets.
Key signals to watch
- Rejection of new highs after a breakout.
- Larger bearish candles and gap downs.
- Confluence of horizontal support levels at the expected target.
Conclusion
This hourly-chart sequence is a textbook example of a support failure that evolves into a head & shoulders breakdown. Whether you trade stocks, intraday futures, or options, focusing on repeated rejections, candle size, and level confluence gives you a concrete plan for entering, sizing, and exiting trades.
Call to action
Watch the full video breakdown to see live chart marking, exact zones, and the real-time trade plan. Subscribe for more trade breakdowns and practical price-action strategies.












Leave a Reply
You must be logged in to post a comment.