
Written and contributed by Kevin Lee, Successful Options Trader of the Month December 2015
1. How to benefit from the butterfly price table? – I use it to help my entry and exit. After you have done this enough time, you will roughly know what butterfly should cost for similar implied volatility (IV) and days to expiration (DTE). This info will help to avoid or to take advantage of temporary butterfly mispricing.
2. How does IV skew affect butterflies? IV skew affects both prices and greeks but the delta is specifically important in trading M3. Firstly we must understand two aspects of the IV skew – (a) the slope and (a) the shape. Look at the IV curve – the left is roughly linear and then about 40 to 50 pts above at the money (ATM), it starts to curve upwards.
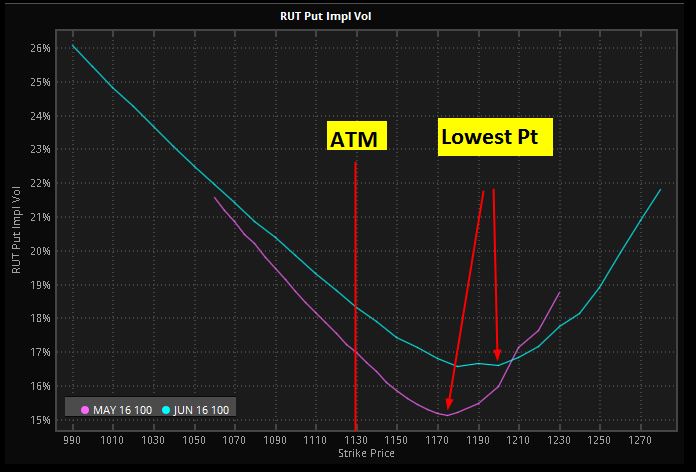
The slope of the linear part typically is steeper when : (a) IV is lower, (b) DTE is smaller.
The lowest point on the curve gets closer to ATM as DTE becomes smaller.
As the market moves up, IV skew becomes steeper, strikes above the market will suffer a bigger IV crush than strikes below the market. Therefore, knowing where the right leg of the butterfly is on the IV curve is important.
Typically after a market sell-off, IV skew will be relatively flatter. For instance, after a sell-off, if RUT is about 10 to 20 pts below short strike of the butterfly, then the right leg will likely be at the point where IV crush will be very severe when the market rebound. In this case, the T+0 line will be inaccurate. It’ll give us a false sense of safety on the upside. That means even if you see a flat T+0 line to the upside, it’s fake. Once the IV crush on the right leg, the T+0 line will sink all of a sudden. That’s because when IV crush, delta becomes much more negative and the P&L suffers more than expected. To mitigate this effect, we need to hedge the upside much more aggressively or pull back the right leg closer, ie turning a regular butterfly to a BWB, or alternatively hedge with more positive that what the software shows.
So we must not think that the lowering of IV is always good for butterfly. That is only true if the IVs of all the legs go down simultaneously. In the real world, that will never happen. As a result, we must not take at face value any of the greeks we see on an analyzer. Instead, we must be aware of where the legs of the butterfly are on the IV curve, understand how individual leg IV will behave and then mentally compensate the greeks.
3. Why is the analysis software inaccurate? The main reason is they don’t model the changes in IV accurately. There are three dynamics that need to be taken into consideration : (1) horizontal shift, (2) vertical shift and (3) slope shift. Let me use an example to illustrate. When the market moves up, firstly the entire IV curve is shifted horizontally. Example – if current RUT Is 1000, ATM IV is 20%. RUT moves to 1020. The IV curve will first shift horizontally such that IV @ 1020 is 20%. After this shift the original strike of 1000 actually shows an increase in IV ! See below L1 to L2.
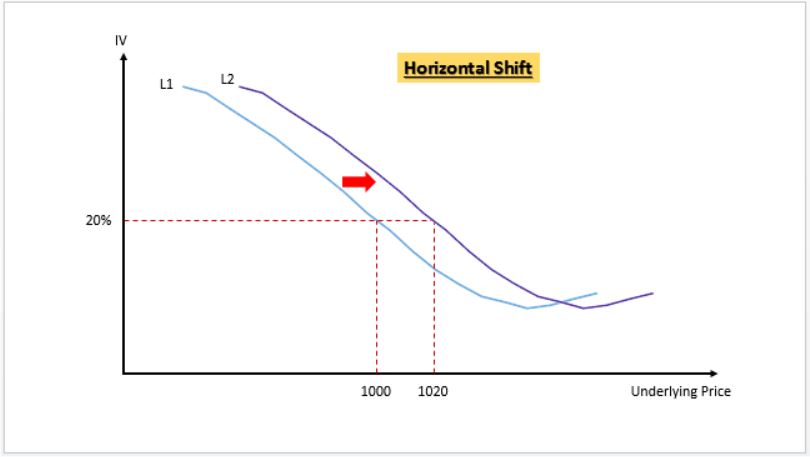
Then step two – vertical shift down. We know that IV goes down as market moves up. The example below – from L2 to L3. So this effect lowers the IV for every strike, countering the increase in IV in step 1. Depends on which effect is bigger, individual IV might end up lower or higher.
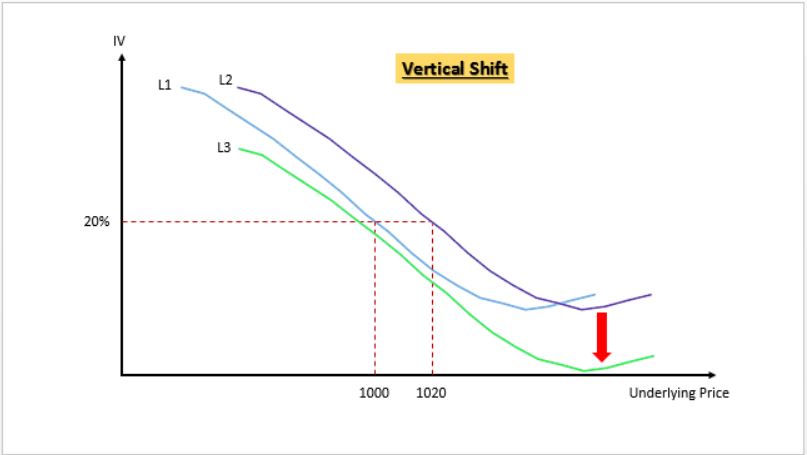
Then step 3 – shift in IV skew. In the case of a reduction of over IV, the IV curve steepens. The example below from L3 to L4. After this clockwise shift in IV curve, some of the lower strike IVs might end up higher than original (ie L4 vs L1).
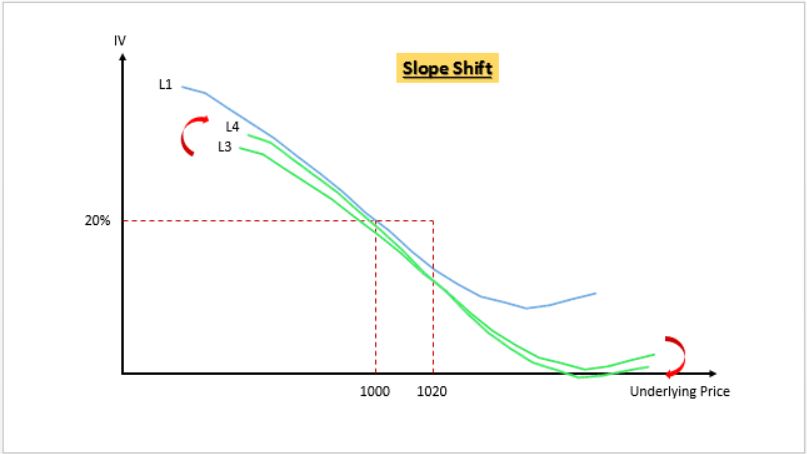
To accurately model option pricing, software needs to model all 3 shifts. Some analytical software takes into consideration step 1 and step 2 via their CEV. But none currently take into consideration step 3, ie the steepening or flattening of IV skew.
To forecast future IV accurately is not a trivial task. The horizontal, vertical and slope shifts are different for each underlying and these shifts also depend on other factors such as absolute IV level, DTE, and market outlook. To model this accurately, the software must start with an accurate regression analysis of the past data – at a minimum incorporating underlying, DTE and IV level. Therefore, my opinion is that the CEV setting must never be a manually inputted number.
4. Why did OV’s modeling create a problem few months ago? It started with OV trying to do a better curve fit. The old projected IV model was based on linear regression. It did not take into consideration of the non-linear part of the IV skew (ie the curving up part). The new model tried to achieve a better curve fit by incorporating the non-linear part. The irony is OV actually succeeded in a closer curve fit, but because OV doesn’t take into consideration of the IV slope change, the net result is the upper strikes IV became way over projected and the overall IV curve became too flat. That created all the problems in T+0 and deltas that we all experienced. Now, they reverted back to a “worse” curve fit but nevertheless a more accurate T+n lines.
What analytical software packages need are an accurate modeling of the shift in IV slope. If that can be achieved, then the better regression model will work. But I know this is really difficult. I hope they succeed so we can all benefit.
Written and contributed by Kevin Lee, Successful Options Trader of the Month December 2015
I have been trading RUT butterflies the past couple of months. Im using TOS’s analytical software – Here is what Im noticing and something that is driving me crazy.
Im managing my T+0 line (and the greeks) effectively – relatively flat throughout. However out of no where there comes a day during the trade wherein the T+0 line just sinks and I am not able to point out what it is. Today was one of those days (and RVX was down 4.5%).
The only explanation could be IV skew. My question is
1. how can I confirm that it’s the skew that is causing the line to sink ?
2. Even after sinking T+0 is still relatively flat – so Im assuming the hedge that you suggested on going +ve delta might have not worked in this case. How can I prevent this from happening in the future ?
I’d like to preface my answer by pointing out that the P/L affect of Implied Volatility changes in multi-legged options positions is quite complex and involves multiple dynamics that are far too involved to explain in this format. Our Enriching Session “What To Do With Options Skew” will provide much more detailed information on how to better understand P/L shifts in these types of positions.
Recognize that there is a big difference between “market IV” (vix, rvx) and the “individual IV of the specific options involved in your position”
Market IV on the RUT (or the RVX) is calculated by aggregating the weighted prices of multiple SPX puts and calls that are 23-37 DTE over a wide range of strike prices.
The individual option IV on the other hand is the IV of a single option.
In addition, with multi legged multi-legged positions, the P/L of those positions is always much more affected by the difference in IV between the individual options than it is by the general IV of the market (RVX)
Now getting to the questions themselves:
1. how can I confirm that it’s the skew that is causing the line to sink ?
IV changes that are different than what the model expects between the options involved in your position is always the reason for unpredicted changes in your T+0 line and position P/L.
By definition of how the analytical software operates, IV skews shifts different from model expectations are always responsible for the unexpected sinking, or rising, of the T+0 line.
2. How can I prevent this from happening in the future ?
An options extrinsic value is created through supply and demand on the option. Variations in this value are measured and expressed as IV much in the same way the speed of your car is measured and expressed as MPH or KPH on your speedometer.
Since you can’t control unexpected market pressures (IV shifts) nor can anyone accurately predict them, there is literally nothing universal you can do to stop T+0 line shifts from occurring. It is simply part of the trading game.
That said, if you want to stop it from happening in a very specific future situation, and you happen to be right about that future situation, then there are certainly things you can do but realize that if you are wrong in that prediction, then you can often make the situation worse.
Thank you John. This is very helpful.
Thanks Kevin,
Good stuff as usual !
As always, great article. Thanks.
Kevin Lee – BEST I HAVE EVER SEEN – to show and explain IV (1) horizontal shift, (2) vertical shift and (3) slope shift
Awesome article Kevin! Keep them coming, please.
Thanx Ray.