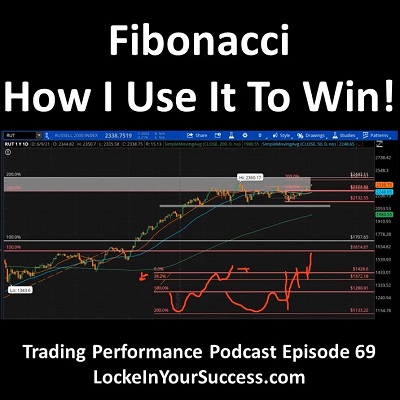
Fibonacci how I use it to win will reveal part of my process that I use to deliver my Market Outlook sessions every week to my students. It is an important part of my preparation to trade every week.
Click here or in the video below to find out!
Subscribe: YouTube
Subscribe: Soundcloud
Fibonacci levels can be used to project various types of support and resistance points depending on what your objectives are.
I use most often use Fibonacci to measure price patterns and project price pattern targets.
I look at the depth of the pattern, the price movement within the pattern, the break out point, and various other factors to project the probability, direction, range, and magnitude of future price movements.

For example, if the market becomes over extended into a price pattern target then I should be aware that most of the time we will get a retracement or a pause sideways. But is that retracement bullish or bearish?
A typical scenario is when the price breaks out of a price pattern, trades up to the price pattern target, and retraces. In this scenario a 30% retracement would be expected. If that happens, it is time to watch for signs of bullish price action again.
Get the specific details in this episode!
The Market Outlook sessions are for subjective traders who are trading subjectively or who want to learn and are preparing to start trading subjectively. In accordance with our Trading Success Blueprint that would be traders who are just entering Stage 4.
Learn more about achieving your trading goals and improving your trading mind by watching all of our future and past Trading Performance Podcast episodes!


Leave a Reply
You must be logged in to post a comment.